Viewing BACnet Statistics
To display the statistics, you must enable it in the channel settings. Learn how
Once enabled, the data is stored as individual statistic points in a .Statistics folder under the channel. You can view the statistic points in Data Browser in Workbench or GraphWorX, or in the Data Explorer stand-alone tool. Data Explorer also allows you to display the statistics in a grid or a chart.
To view the statistics in Data Explorer:
-
In the Windows search box, enter data explorer and open the Data Explorer tool with administrator privileges. If a Windows dialog appears, click Yes.
- In the left pane, expand Data Connectivity > BACnet, and then expand the desired channel.
-
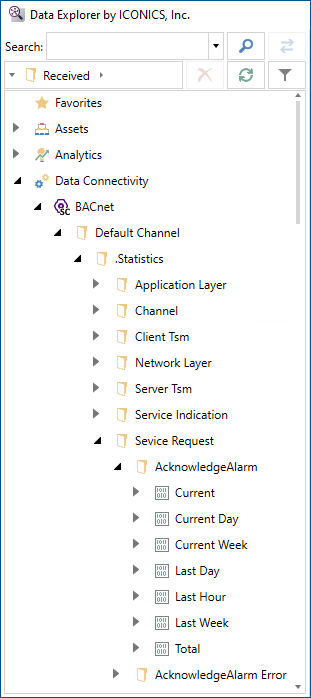
Expand the .Statistics folder and navigate to the desired statistic point.
-
Click the desired statistic point to display the values in the main pane.
Clicking a folder displays all statistic points contained in that folder in one view.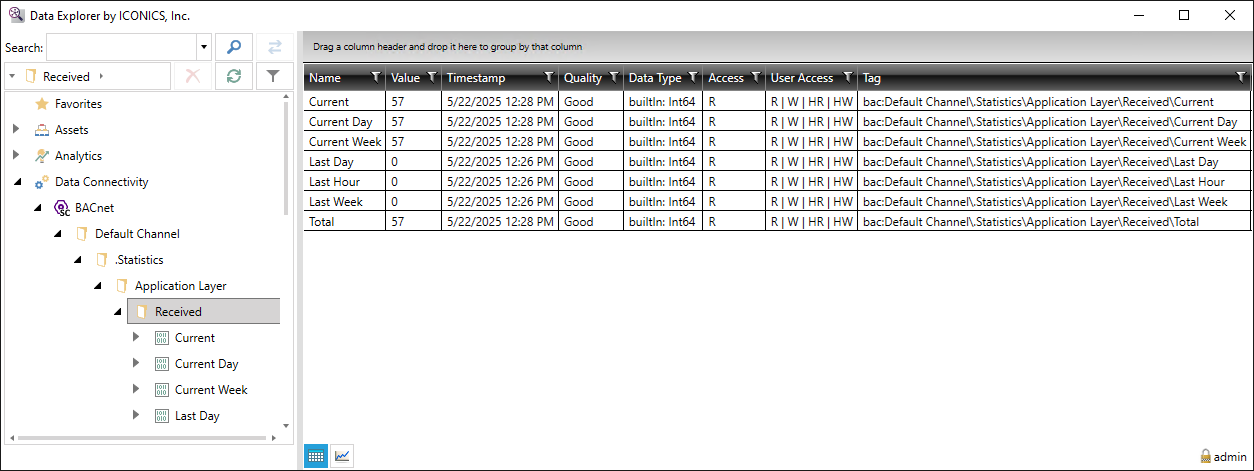
- Use the
 and
and  icons at the bottom left to switch between a grid view with the details about individual statistics data points and a graphic trend view.